Kyverno Monitoring
Monitor Kyverno policy metrics with Prometheus
Introduction
As a cluster administrator, it may benefit you to have monitoring capabilities over both the state and execution of cluster-applied Kyverno policies. This includes monitoring over any applied changes to policies, any activity associated with incoming requests, and any results produced as an outcome. If enabled, monitoring will allow you to visualize and alert on applied policies, and is critical to overall cluster observability and compliance.
In addition, you can specify the scope of your monitoring targets to either the rule, policy, or cluster level, which enables you to extract more granular insights from collected metrics.
Installation
The instructions below are for deploying kyverno reporting in a BigBang cluster with monitoring and kyverno packages enabled.
Execute the installation steps as mentioned in overview document. Monitoring is turned on by the following chart values, which are set by default:
upstream:
  monitoring:
    enabled: true
    grafana:
      dashboards:
        enabled: true
Kyverno Metrics
Policies and Rule Counts
Metric Name: kyverno_policy_rule_info_total
Metric Type: Gauge
0 - if the rule is not anymore present in the cluster (although it was created in the past).
1 - if the rule is currently actively present in the cluster.
This metric can be used to track the number of policies as well as rules present in the cluster which are currently active and even the ones which are not currently active but were created in the past.
Policy and Rule Execution
Metric Name: kyverno_policy_results_total
Metric Type: Counter
An only-increasing integer representing the number of results/executions associated with the rule corresponding to a metric sample.
This metric can be used to track the results associated with the rules executing as a part of incoming resource requests and even background scans. This metric can be further aggregated to track policy-level results as well.
Policy Rule Execution Latency
Metric Name: kyverno_policy_execution_duration_seconds
Metric Type: Histogram
A float value representing the latency of the rule’s execution in seconds.
This metric can be used to track the latencies associated with the execution/processing of the individual rules whenever they evaluate incoming resource requests or execute background scans. This metric can be further aggregated to present latencies at the policy-level.
Policy Change Counts
Metric Name: kyverno_policy_changes_total
Metric Type: Counter
An only-increasing integer representing the total number of policy-level changes associated with a metric sample.
This metric can be used to track the history of all Kyverno policy-related changes such as policy creations, updates, and deletions.
Admission Review Latency
Metric Name: kyverno_admission_review_duration_seconds
Metric Type: Histogram
This metric can be used to track the end-to-end latencies associated with the entire individual admission review, corresponding to the incoming resource request triggering a bunch of policies and rules.
Admission Requests Counts
Metric Name: kyverno_admission_requests_total
Metric Type: Counter
This metric can be used to track the number of admission requests which were triggered as a part of Kyverno.
Prometheus Dashboard
Big Bang exposes Prometheus through its own ingress. With Big Bang’s test values this is https://prometheus.dev.bigbang.mil/
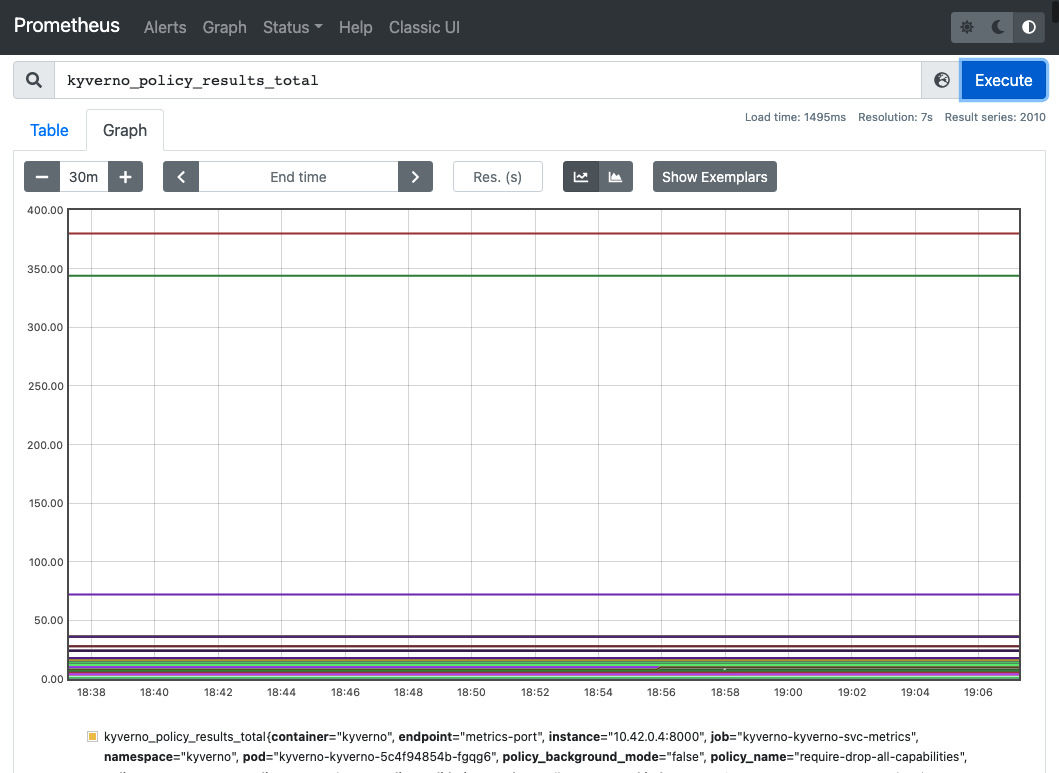
The metrics are sourced from Kyverno endpoints that can be verified by targets at https://prometheus.dev.bigbang.mil/targets
serviceMonitor/kyverno/kyverno-admission-controller/0
serviceMonitor/kyverno/kyverno-background-controller/0
serviceMonitor/kyverno/kyverno-cleanup-controller/0
serviceMonitor/kyverno/kyverno-reports-controller/0
serviceMonitor/kyverno-reporter/policy-reporter-monitoring/0
Grafana
Big Bang exposes Grafana through its own ingress. With Big Bang’s test values this is https://grafana.dev.bigbang.mil/
Verify that Prometheus datasource is setup by navigating to the following url. This datasource is automatic created when monitoring is enabled in BigBang installation.
https://grafana.dev.bigbang.mil/connections/datasources
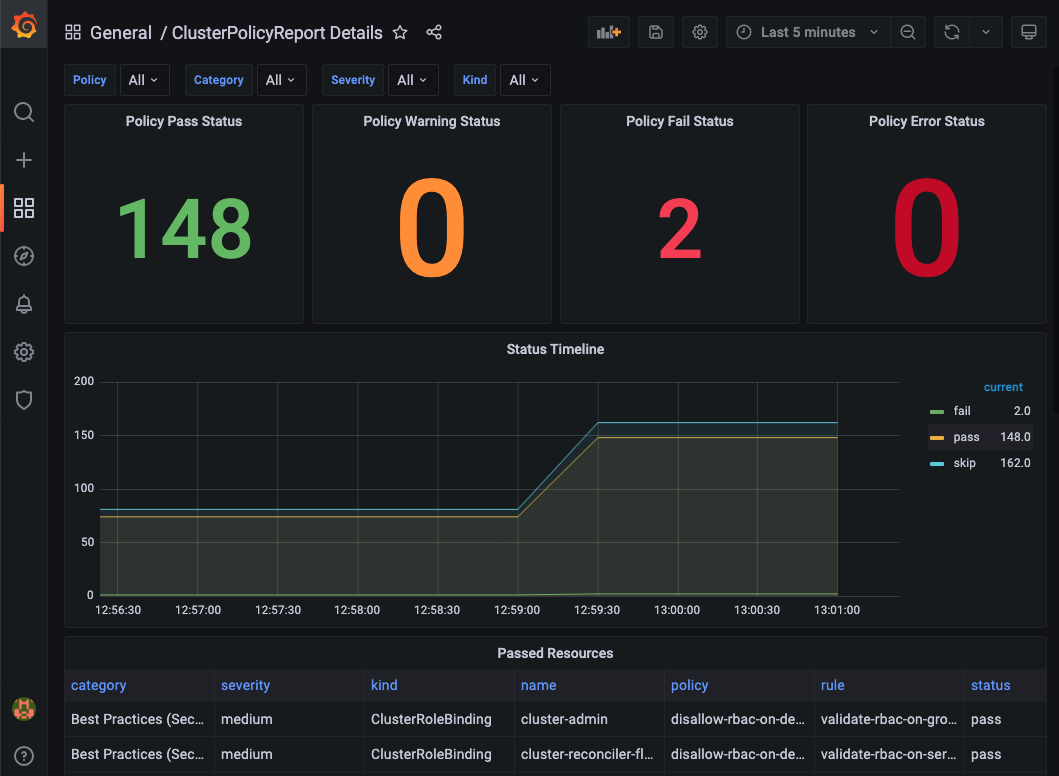
Policy Report Dashboards
Search for the Policy Report dashboards by navigating to the following url.
https://grafana.dev.bigbang.mil/dashboards?&query=policyreport
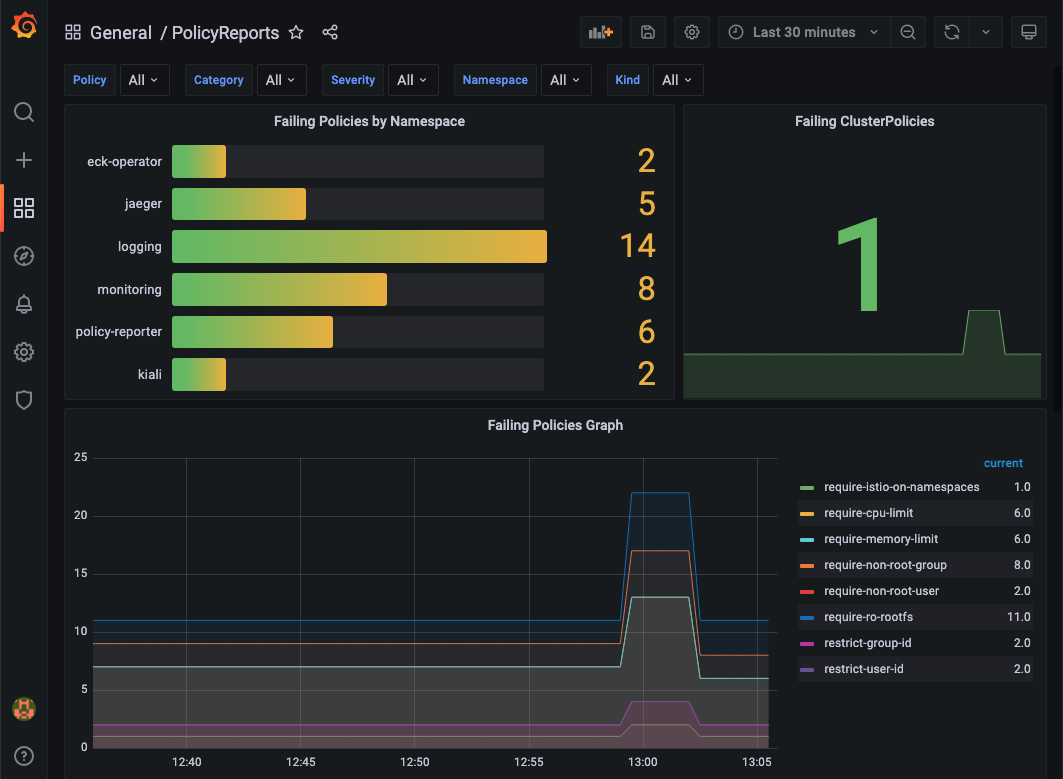
This results in dashboards tagged with Policy Reporter
Cluster Policy Report Details
Policy Report Details
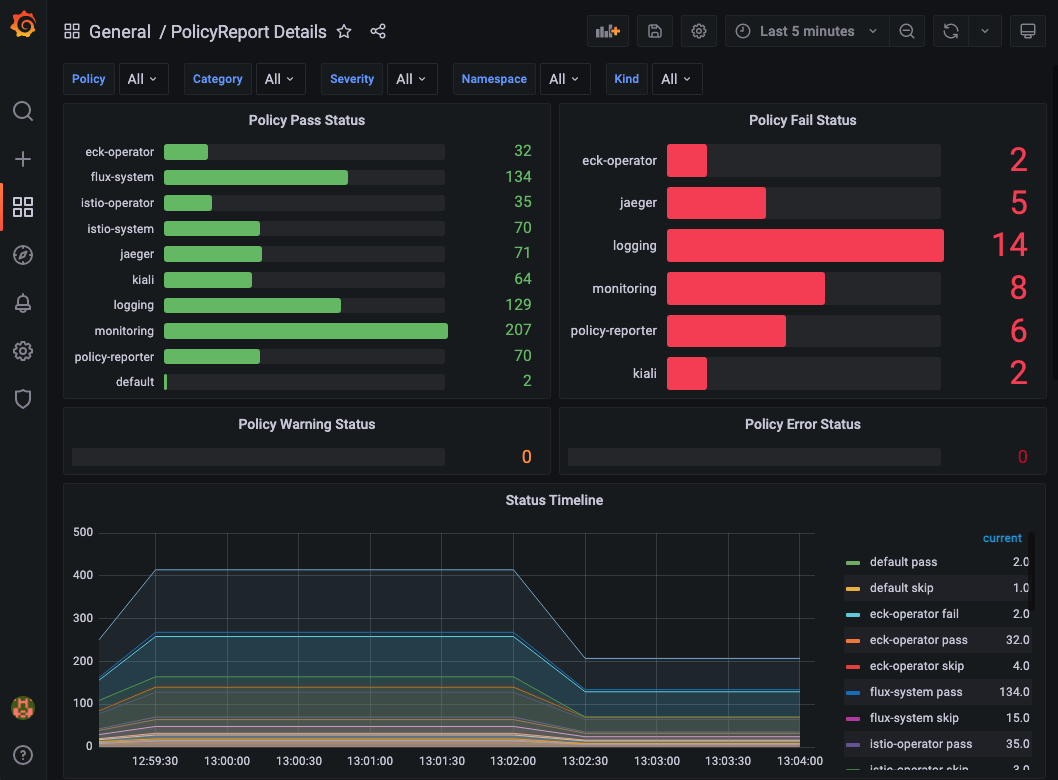
Policy Reports
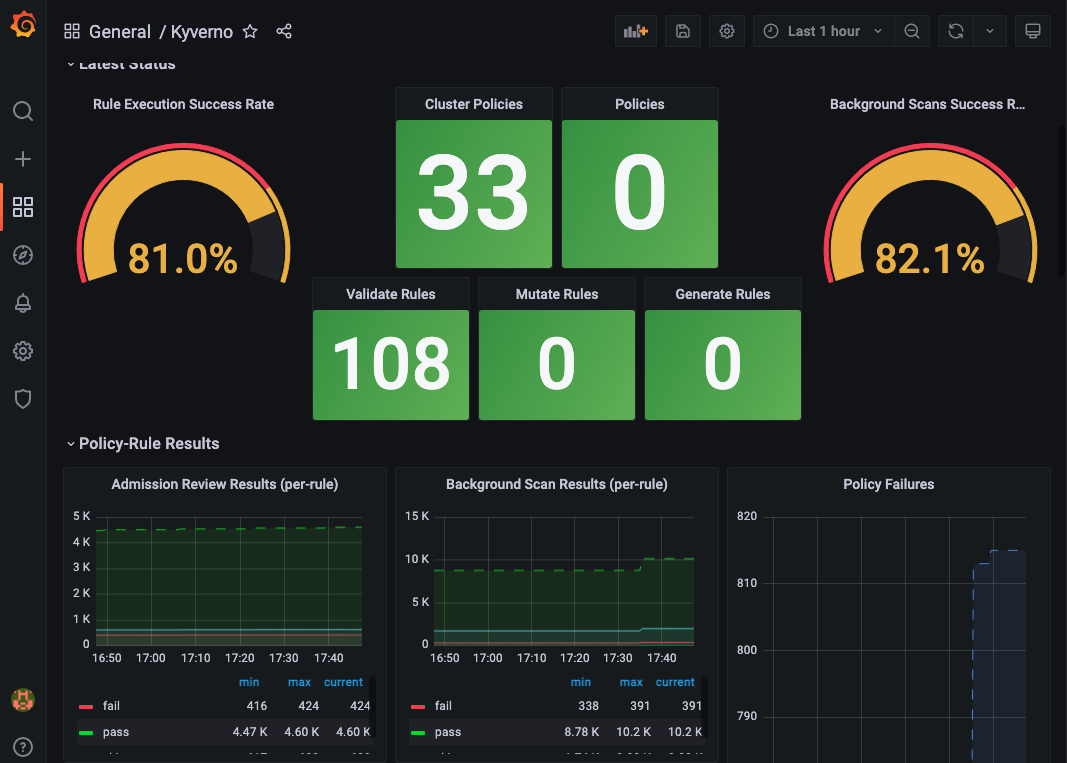
Kyverno Dashboard
Search for the Kyverno dashboard by navigating to the following url.
https://grafana.dev.bigbang.mil/dashboards?&query=kyverno
Select the returned row to navigate to the dashboard as shown below: